GUI for EMIR
350
-- guiOD叩Dvirtual character[狗子闻, 首叩DD歌叩DDDDmiku (From SiQi, 20220903)
HVP Report Collection
The usage model: HVP uses report_emir_data to collect all the analysis result to disk.
350
HVP GUI Usage Model
GUI usage overview
Common GUI usage:
GUI functions under plan:
HVP usage overview
550
HVP Waveform Viewer
-
ticket keywords: waveform_viewer #22122 plot waveform through open files
l. load IVP
2.view—waveform --interactive
3.click "File" > "Open", to load files
4.double click items to draw curves 髻髻髻髻 file format 髻髻髻髻 data—namel,xl,yl,x2,y2,... data—name2,xxl,yyl,xx2,yy2,... -
plot instance current/voltage
髻 step l: Must setup observed instance before IR and plot waveform set—power—network—mode -inst "some instances"
髻 step 2: do dynamic IR analysis
髻 step 3: plot voltage or current plot—instance—current -inst xxxx -net VDD plot—instance—voltage -inst xxxx -net VSS
髻 step 4: (optional) write to waveform file plot—instance—voltage -inst xxxx -net VDD -output—file file plot—instance—current -inst xxxx -net VDD -output—file file
髻 step 5: (optional) load from waveform file plot—instance—voltage -from—file file plot—instance—current -from—file file
- plot_supply_location_current/volage
髻 step l: Must set -observe—supply—location option in dynamic IR analysis command analy江e—dynamic—ir—drop -vector—file vector.vcd -start—time O -end—time l -with—package -observe—supply—location
髻 step 2: get supply locaiton ploc name report—supply—locations
髻 step 3: plot supply location voltage or current plot—supply—location—current xxxx plot—supply—location—voltage xxxx
髻 step 4: (optional) write to waveform file plot—supply—location—current xxxx -output—file file plot—supply—location—voltage xxxx -output—file file
髻 step 5: (optional) load from waveform file plot—supply—location—current -from—file file plot—supply—location—voltage -from—file file
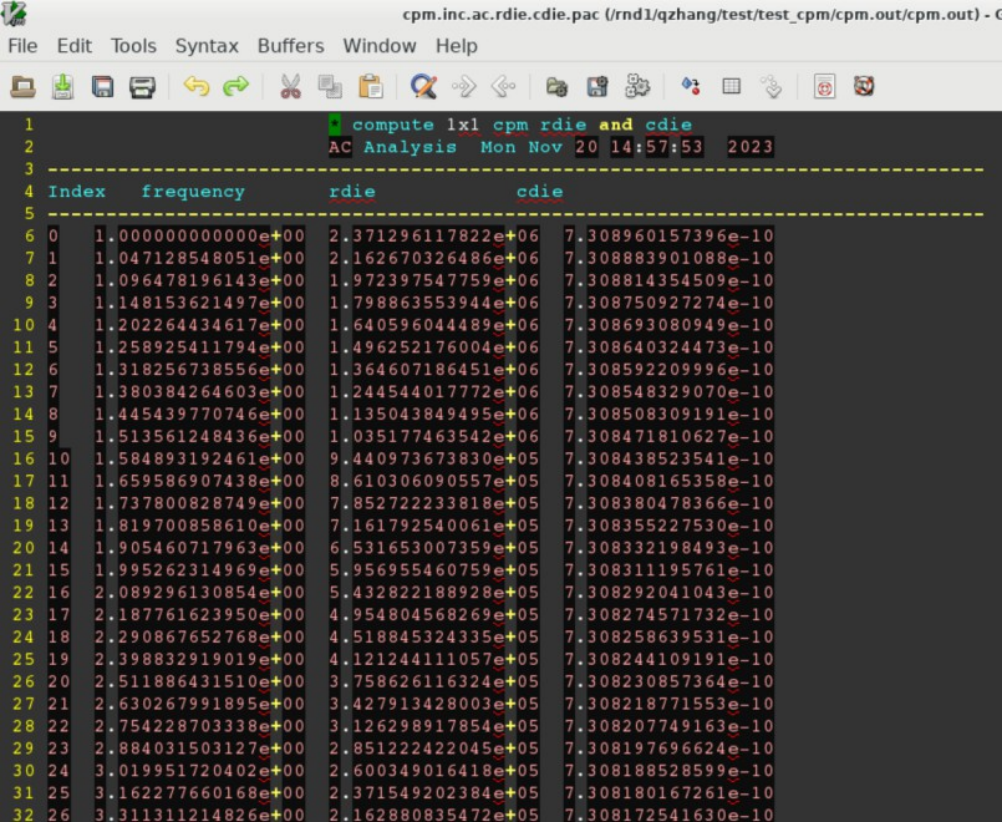
- plot cpm
DDD netlist --->□DODD .pacD叩----> DDD view—waveform□□ .pacD叩
D田DD卿netlist旧式叩

.pac叩叩卿叩型旧式叩O叩D叩
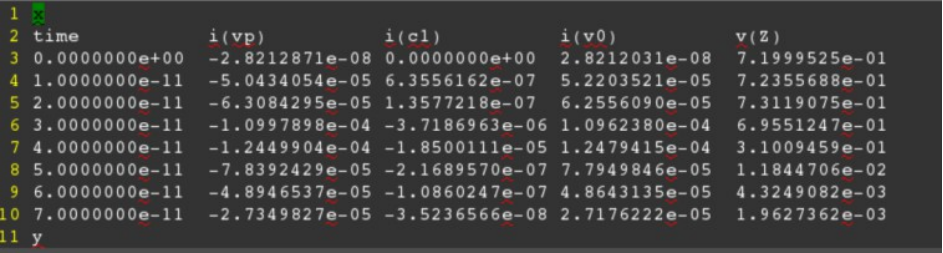
- plot_hpl_signal
D叩D伲□伲加□两叩
□叩□ time value time value(.out伲□ ) tl vll tl v2l tl v3l ...
t2 vl2 t2 v22 t2 v32 ...
...
DO□叩□ .printtrO伲□
- gui interface
350
HVP waveform file format
- standard file format
  D DD叩□D伲□
  髻format wavetype x-axis-unit y-axis-unit
  D 伲D
  formatDDD叩伲□
   wavetypeDD00D叩D伲型DO叩或叩O叩
  x-axis-unitDD xDDDD
  y-axis-unitDD yDDD
  □ DDDDDDD
  髻lOO l ns v
  -225,O,O,l,l,.....
  D 伲D lOODD tv伲□ , ODDO叩
formatO叩D

  = lOO	// DDD叩伲□D signal—name,tl,vl,t2,v2...伲□
  = lOl	// D叩伲□D .pac
wavetypeO叩D

  = O	// TIMF O叩00
  = l	// FRFQ O叩0 0 00DO叩00
  = 2	// FRFQ FFTDDDDDDO叩0 0 幅叩D加 2OdB0D
- specified suffix file
  D DDD叩□DDDDDDDD叩
 .tr*	//trOD叩DDDDD .tr2 .tr4 ...DDD叩
 .print  //00D00D
 .wrd	//
 .pac	//
GUI for resistance analysis
report_pg_resistance, show detailed path in layout GUI
report—pg—resistance -net VDD xx(inst) -detail—path -highlight
yellow path is abnormal
//if you don't want min path to be highlighted
report—pg—resistance -net VDD xx(inst) -detail—path
report_pg_resistance_reference, compare detailed path between tools
report—pg—resistance—reference -ref—file test.rpt -instance -2838 -net VDD highlight min path from file
Heat map (TBD.)
Analog waveforms (TBD.)
3D GUI utility (TBD.)
Archieve: Plot current waveform from csv file (obsolete)Archieve: Plot current waveform from csv file (obsolete)
Plot current waveform (obsolete)
load—prollect db/place—func—ss—rcmax.db
set—app—var ta power—force—skip—timing true
set—app—var ir dynamic—sim—time—step O.Ol
import—twf design.twf
report—emir—current * -net VDD -output—file wv-vdd-sumup.csv
report—emir—current u—ca5—cs/-V* -by—cell -net VDD -output—file wv-vdd-by—cell.csv
plot—emir—signal -waveform—file "wv-vdd-sumup.csv wv-vdd-by—cell.csv"
500
Waveform Viewer□持叩文叩格叩
HVP GUI Development Center
Qt solutions to be investigate:
https://github.com/jkriege2/JKQtPlotter
https://qwt.sourceforge.io/otherscreenshots.html
dbFigure
learn dbFigure
dbFigure Relation: http://10.30.200.21:8088/projects/hongtu-emir/wiki/New_GUIer_start_up
pay attention to unit conversion : if you use tclsh to input coordinate the unit is um ; but final dbFigure the unit is nm DD叩tclshDDD卿DD卿D□DdbFigureDD卿DD卿D□DDDDDDDDDDDDDDDDDDDDDDDDDDDDDDDD
tcl command : add—drawing -figure name text {O 25} 2O "name"
C++ code :	fig->AddText(O, 25OOO, 2OOOO, name, false)
report_supply_locations
D DDD0DDDDDDDD0D
VDD----yellow VSS---white
0DD□D highlightDDDDDD伲0DD加DD layoutDDDD DDDDDD highlightD VDD/VSS
delete—figure emir—supply—fig
Qt
How to Write Qt Dialog
http://10.30.200.21:8088/projects/hongtu-emir/wiki/How_to_Write_Qt_Dialog
pop-up image viewer(#11539)
show—emir—image a.png
Qt WebEngine(#9999)
show—emir—webpage /rndl/q江hang/binary/test/hello.html
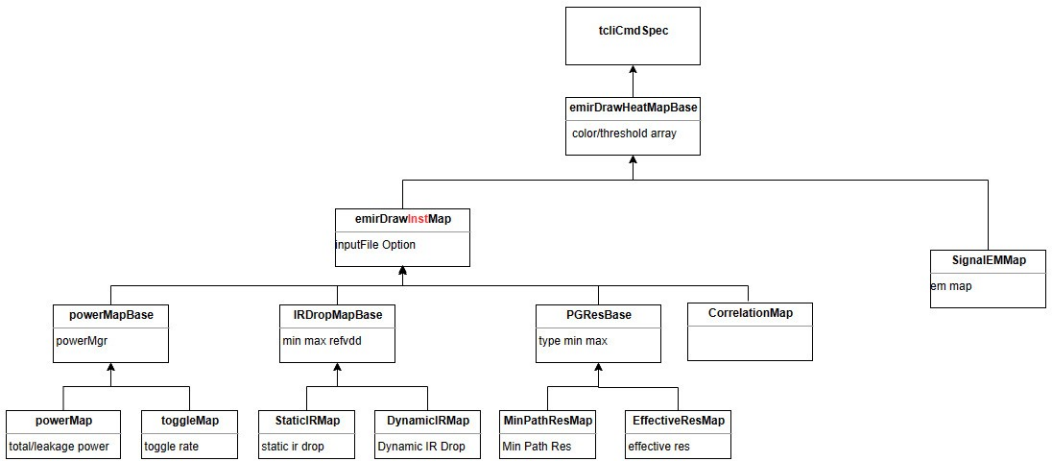
Heat Map
Heat Map Work Flow
Heat Map Time Complexity
| case | cell number | dynamic—ir—db time | power—map(total power) time |
|---|---|---|---|
| caseOO3 | 3l2462 | O.23s | |
| caseOO4 | 2OOO8l2 | l.4Os | |
| caseOO5 | lO834949 | 5.3ls | 52.O9s |
HVP GUI regression
layout regression check
step1: implement your function use dbFigure.make sure it can show on layout
step2: write your regession,set checkpoint, eg:
(l) mkdir min—path—resistance—check—gui
(2) cd min—path—resistance—check—gui
(3) write test.tcl use export—layout -format png a.png to save your layout
(4) run your test.tcl you will finnaly get a.png, rename a.png to a.png.golden
(5) add checkpoint eg:
start—checkpoint cpl diff—png a.png.golden a.png
end—checkpoint
(6) git add your regression case,确叩本叩和叩务叩上叩可叩跑叩
GUI模叩人叩操叩叩叩归叩试叩例叩D
From 春叩叩
10叩工叩OOODhongtu_hk/ut/tests/ut/guiD创叩回叩测叩叩叩DD叩叩叩gui_unit_route_guide_draw D
- DD test.tcl DDD叩DDDD叩DD卿DDD叩DD叩O卿DDDOODD
DAGDDD
set_param basic print_gui_cmd 1 #的印叩guiOO叩O卿D叩D叩guiDDDOODD叩叩叩被DO的印DD
gui_record start /rnd/khuo/ut/test/ut/gui/xxx/test.tcl #D动叩OguiOO卿D叩Dtest.tclDD叩D叩叩D加卿dialogDut
DDD叩叩卿DDDD截DDexport_layout -format png route_guide_show.png #D叩叩叩叩叩D叩境OOO叩OD田叩D叩叩动叩zoomD田合叩卿D0D叩D叩捷叩 z DD选叩区叩放叩D
叩D叩叩获叩dialogD□田叩叩卿D加D叩叩叩获叩□田checkbox卿D加D叩D叩gui_event qti::checkbox::::get .d0 cb.xxx -checked (gui_event卿ODDDDmasterOD叩DD.d0DD叩田叩OD叩DDD$top)
dialogDODOO叩DDDDcmdD叩卿opt叩叩ODDD叩叩D田叩D叩O叩DutTestD叩叩叩叩Dplace_optimizeD叩卿-phase optionOD叩D
叩D叩叩D place_optimize --get_option -phase D叩获叩叩DD卿-phase optionDD卿DDDDD D叩D叩ODDD卿D叩D叩test.tclDDD
D叩O卿pngD0复DD hongtu_hk/ut/tests/ut/gui/gui_unit_route_guide_draw OOOD并叩叩叩名叩叩叩叩 route_guide_show.png.golden
30叩叩sh020叩DDhongtu_hk/ut/tests/ut/gui/gui_unit_route_guide_draw OOOD叩DO叩D叩叩
/reg/util/run_test.pl --binary /rnd/khuo/hongtu_hk/work/bin/rhel6-64/AG . D叩DDDD卿DDDDD叩DDDDDD叩DDDDDD□DfailingDD叩DDOD卿叩叩DDD□wkreg.error叩叩DD卿DDDDD叩D叩DDDDD
Reference
Sphinx quick guide: Sphinx.docxhttps://www.sohu.com/a/401323062_120502794
gui cmd: gui_cmd.docx
AG GUI: http://10.30.200.21:8088/projects/understand-aguda/wiki/Aguda_GUI
Updated by jun chen 4 months ago · 6 revisions